The Virtualization Engine Is Revving Up 🚀
The virtual machine (VM) market isn't just growing—it's becoming the backbone of modern IT infrastructure. Valued at $13.7B in 2025, SNS Insider projects it to hit $53.52B by 2035, a compound annual growth rate of 14.6%.
This isn't a flash-in-the-pan trend. The shift is structural: enterprises are moving away from legacy hardware toward cloud-native, hybrid, and multi-cloud environments. The demand for AI, high-performance computing (HPC), and secure application testing is creating a sustained tailwind for virtualization providers.
Investors should view this as a secular growth story rather than a cyclical bounce. The key drivers—AI adoption, edge computing, and regulatory compliance (GDPR)—are all long-term forces.

Segment Deep Dive: Where the Money Is Moving 💸
Type: System VM Dominates, Process VM Accelerates 🏆
System VMs held a commanding 71% revenue share in 2025. Why? They allow multiple OS instances on a single physical server, making them essential for server consolidation, cloud computing, and enterprise workloads. Think of them as the workhorses of the data center.
However, the fastest growth is coming from Process VMs, expected to register the highest CAGR from 2026–2035. This is driven by the rise of platform-independent software development, microservices, and DevOps. As more developers build cloud-native apps, the need for portable, isolated runtime environments skyrockets.
Organization Size: Large Enterprises Lead, SMEs Catch Up Fast 📊
Large enterprises accounted for 69% of revenue in 2025. They have the capital to invest in private clouds, large data centers, and sophisticated virtualization stacks.
But the real story is the SME segment, projected to grow at the fastest CAGR. Why? Cloud-based virtualization removes the need for massive upfront capital expenditure. SMEs can now access enterprise-grade IT capabilities on a subscription basis, leveling the playing field.
The market is split on whether VMs will remain kings or be dethroned by containers. Here’s how the bulls and bears see it:

Regional Showdown: North America vs. The World 🌍
| Region | 2025 Market Share / Size | Key Driver | Projected CAGR |
|---|---|---|---|
| North America | ~38% share (US: $3.36B) | AWS EC2 dominance, cloud-first gov. policy, BFSI & healthcare adoption | 13.4% |
| Europe | $2.74B | GDPR compliance, sovereign cloud demand (Germany ~24.6% of EU revenue) | 13.4% |
| Asia Pacific | Fastest growing | China's digital economy (CNY 50T+), India & SE Asia IT spending boom | 15.7% |
Key Insight: While North America leads in absolute terms, Asia Pacific is the growth engine. The combination of a massive digital economy in China and rapid digitization in India and Southeast Asia makes this region the one to watch. Investors with exposure to APAC cloud providers (e.g., Alibaba Cloud, Huawei) could see outsized returns.
A Technical Note for Traders 📉
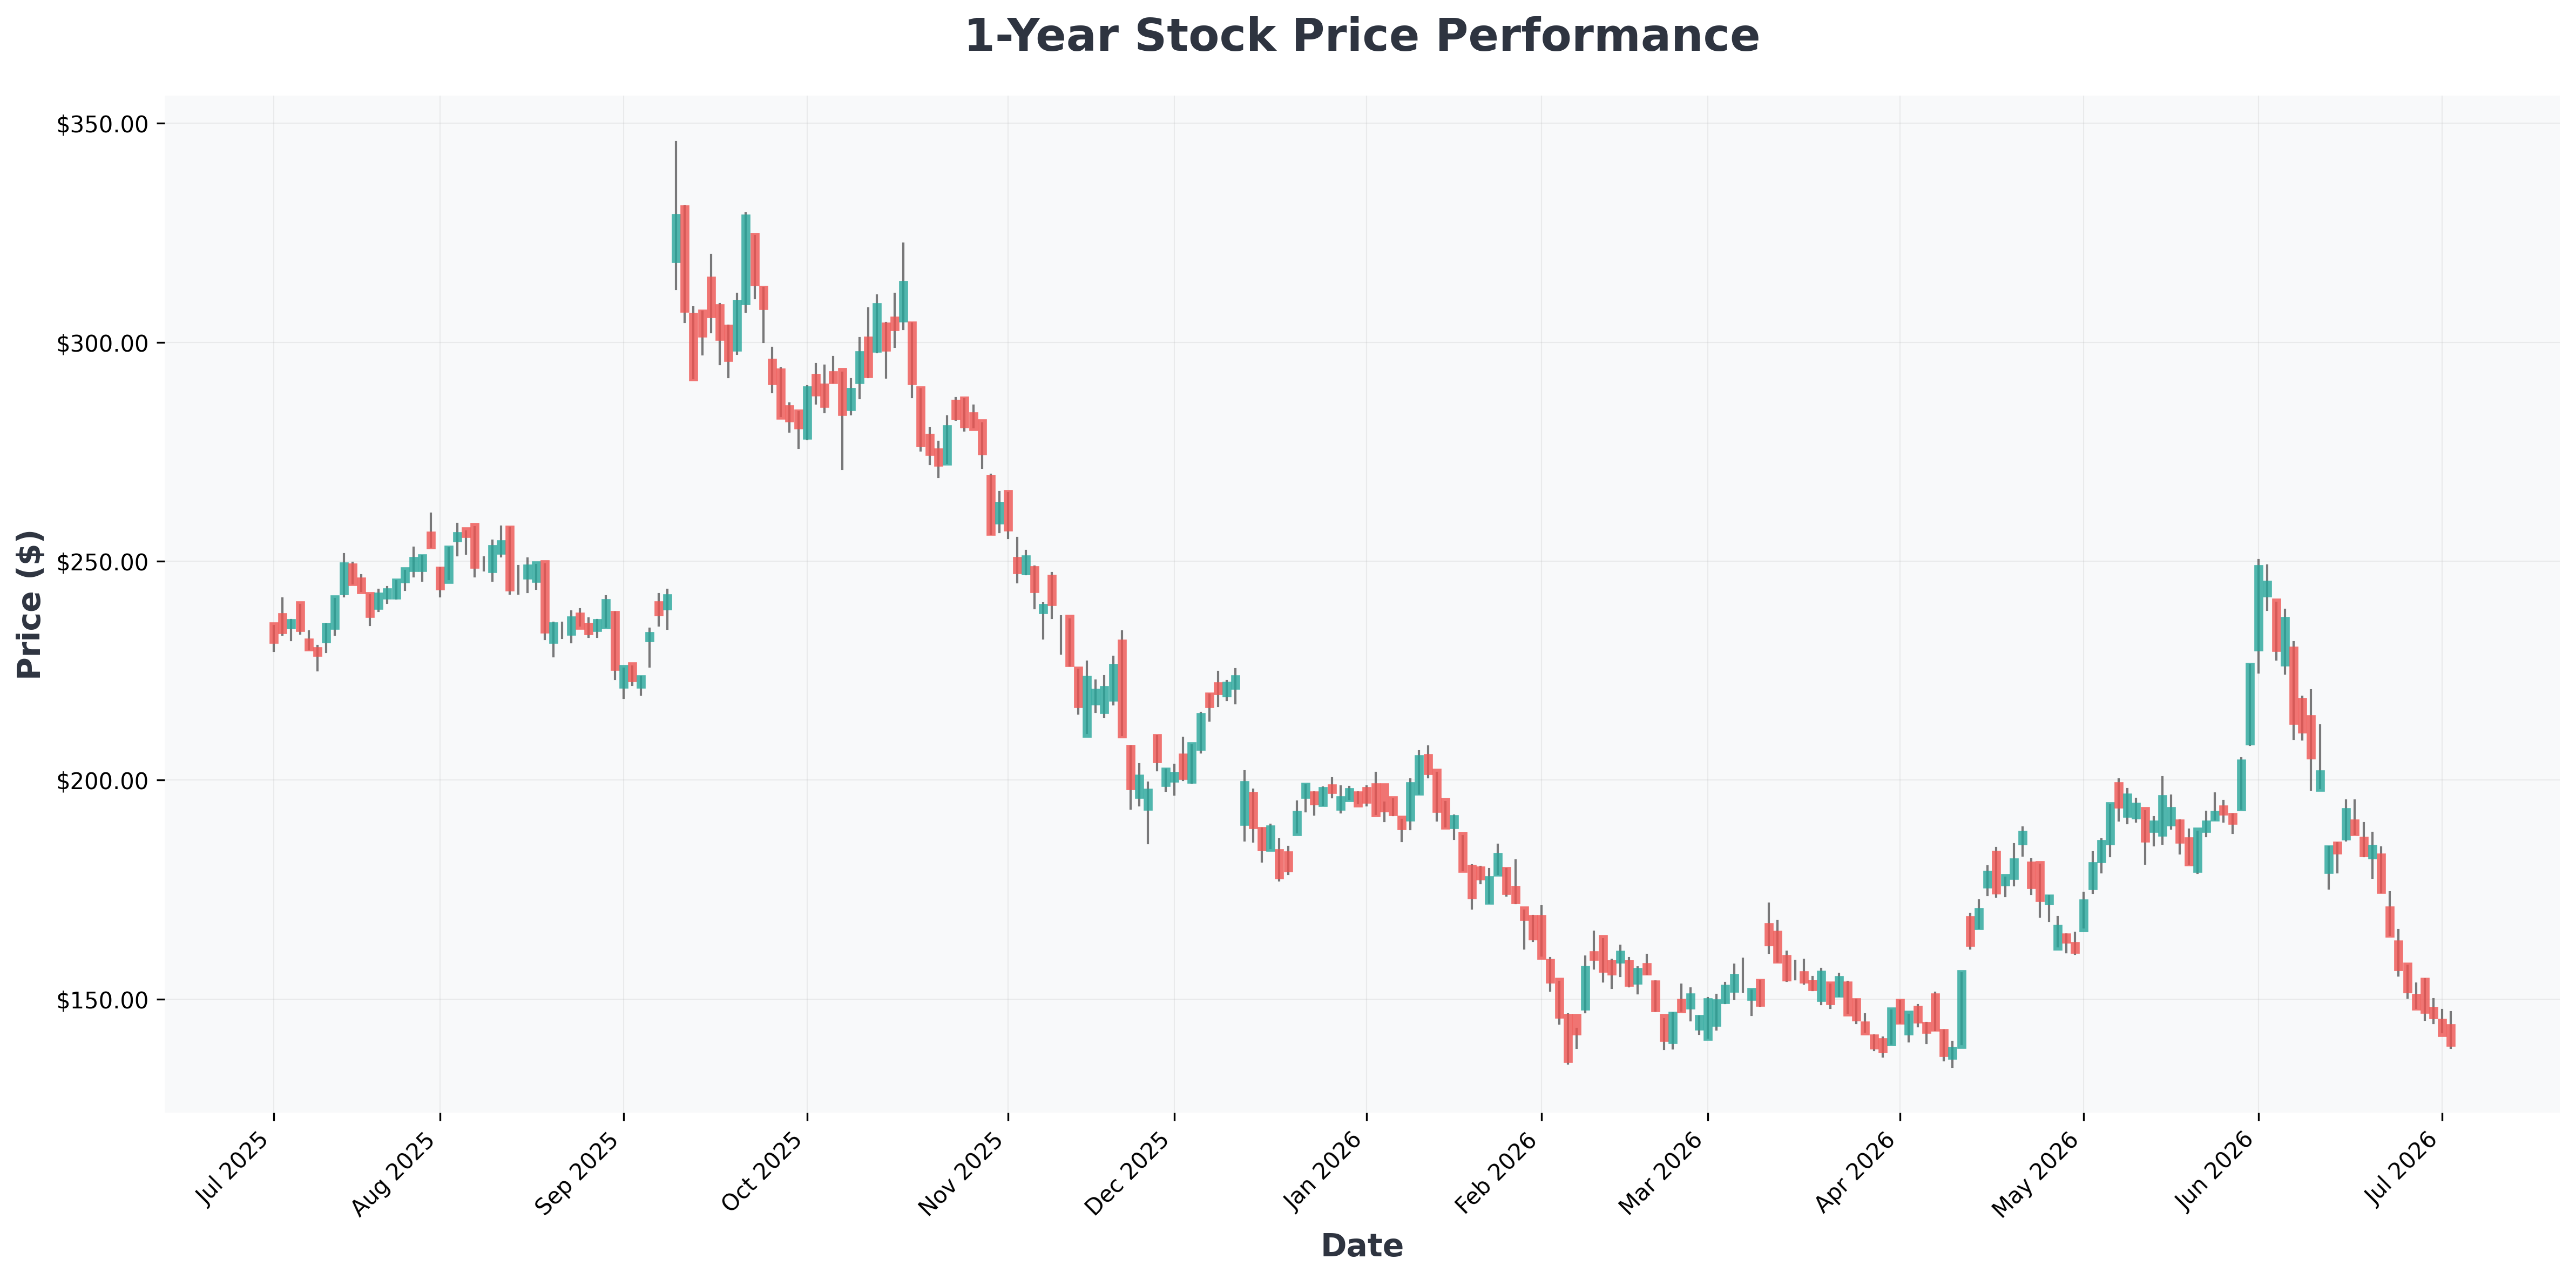
From a technical perspective, the VM market is currently in a strong accumulation phase following the post-pandemic normalization. Historically, IT infrastructure markets that sustain >12% CAGR for a decade tend to see a 2.5x to 3.5x revenue multiple expansion in the later innings. If this pattern holds, the current $13.7B base could be conservatively valued at a $40B+ enterprise value by 2030, suggesting significant upside for pure-play virtualization stocks.
📊 In-Depth Fundamental Analysis
| Company | Share Price | P/E Ratio | P/B Ratio | ROE | Operating Margin (OPM) | Revenue Growth |
|---|---|---|---|---|---|---|
| AMZN (Amazon.com,) | $243 | 31.64 | 5.91 | 24.29% | 13.14% | 16.60% |
| AVGO (Broadcom) | $360 | 59.88 | 19.56 | 37.28% | 48.99% | 47.90% |
| CSCO (Cisco) | $113 | 37.56 | 9.09 | 25.23% | 24.99% | 12.00% |
| DELL (Dell) | $394 | 31.44 | -182.30 | 0.00% | 8.86% | 87.50% |
| GOOG (Alphabet) | $356 | 27.17 | 9.01 | 38.88% | 36.12% | 21.80% |
| GOOGL (Alphabet) | $360 | 27.47 | 9.11 | 38.88% | 36.12% | 21.80% |
| HPE (Hewlett) | $41 | 38.53 | 2.16 | 6.31% | 8.70% | 40.00% |
| IBM (International) | $290 | 25.64 | 8.25 | 35.77% | 13.81% | 9.50% |
| MSFT (Microsoft) | $390 | 23.26 | 7.00 | 34.01% | 46.33% | 18.30% |
| ORCL (Oracle) | $140 | 24.02 | 10.76 | 53.38% | 36.20% | 20.60% |

Scenario Analysis: Best Case vs. Worst Case 🎯
Bull Case (Probability: 60%) 🐂
- AI & HPC demand accelerates beyond current forecasts.
- Multi-cloud adoption becomes standard, driving demand for cross-platform VM management tools.
- SME adoption explodes as cloud VM costs continue to drop.
- Market size exceeds $60B by 2035.
Bear Case (Probability: 25%) 🐻
- Containerization (Kubernetes, Docker) replaces VMs for a significant portion of workloads.
- Economic slowdown forces enterprises to delay IT infrastructure upgrades.
- Regulatory fragmentation (e.g., differing data sovereignty laws) increases complexity and costs.
- Market size stalls around $40B by 2035.
Base Case (Probability: 15%) 📌
- Steady growth as predicted, with VMs and containers coexisting.
- VMs remain dominant for legacy apps, while containers take over new cloud-native deployments.
- Market hits the projected $53.52B, with a CAGR of 14.6%.
Conclusion: The VM market offers a compelling risk-reward profile for long-term investors. The key risk is containerization, but the sheer inertia of enterprise IT and the rise of AI workloads provide a strong moat. Focus on companies that offer both VM and container orchestration (e.g., VMware/Broadcom, Microsoft Azure, AWS) to hedge against technological shifts.
