The S&P 500 Is Running Hot — and a Handful of Names Are Doing the Heavy Lifting 📌
The S&P 500 (^GSPC) has delivered total returns of nearly 18% over the past 12 months — well above its long-term average of roughly 10%. But beneath that headline number lies a structural shift that every long-term investor should understand.
The technology sector inside the index has surged roughly 46% over the last six months, while every other industry combined returned only about 11% during the same stretch. That kind of divergence is not normal — and it's the reason concentration risk is back on the radar of institutional strategists.
When a small group of stocks drives the entire index higher, the upside feels great. The problem is what happens on the way down. 🔍

The Top 10 Stocks Now Control 39% of the Index
As of this writing, the S&P 500 carries a total market value of roughly $70.4 trillion. The ten largest holdings alone account for about $27.4 trillion — or 39% of the entire index.
Those names, in order, are: Nvidia, Apple, Alphabet, Microsoft, Amazon, Meta Platforms, Broadcom, Tesla, Micron Technology, and Berkshire Hathaway.
According to data from S&P Global, the last time the index was this concentrated was 1965. Back then, the top holdings were industrial and telecom giants like AT&T, General Motors, IBM, and DuPont — a far more diversified mix of sectors.
Nearly every one of today's top holdings is either directly or tangentially tied to AI infrastructure. Amazon, Meta, Microsoft, and Alphabet collectively spent over $300 billion on data centers in the first half of 2026, and those four companies are expected to account for nearly half of global AI infrastructure spending this year.
The Break-Even Math Is Brutal 💸
Goldman Sachs estimates that hyperscalers will need to generate at least $300 billion in AI revenue over the next few years just to break even — and roughly $1 trillion per year to sustain healthy margins. If that revenue doesn't materialize, the ripple effect across the index could be severe.
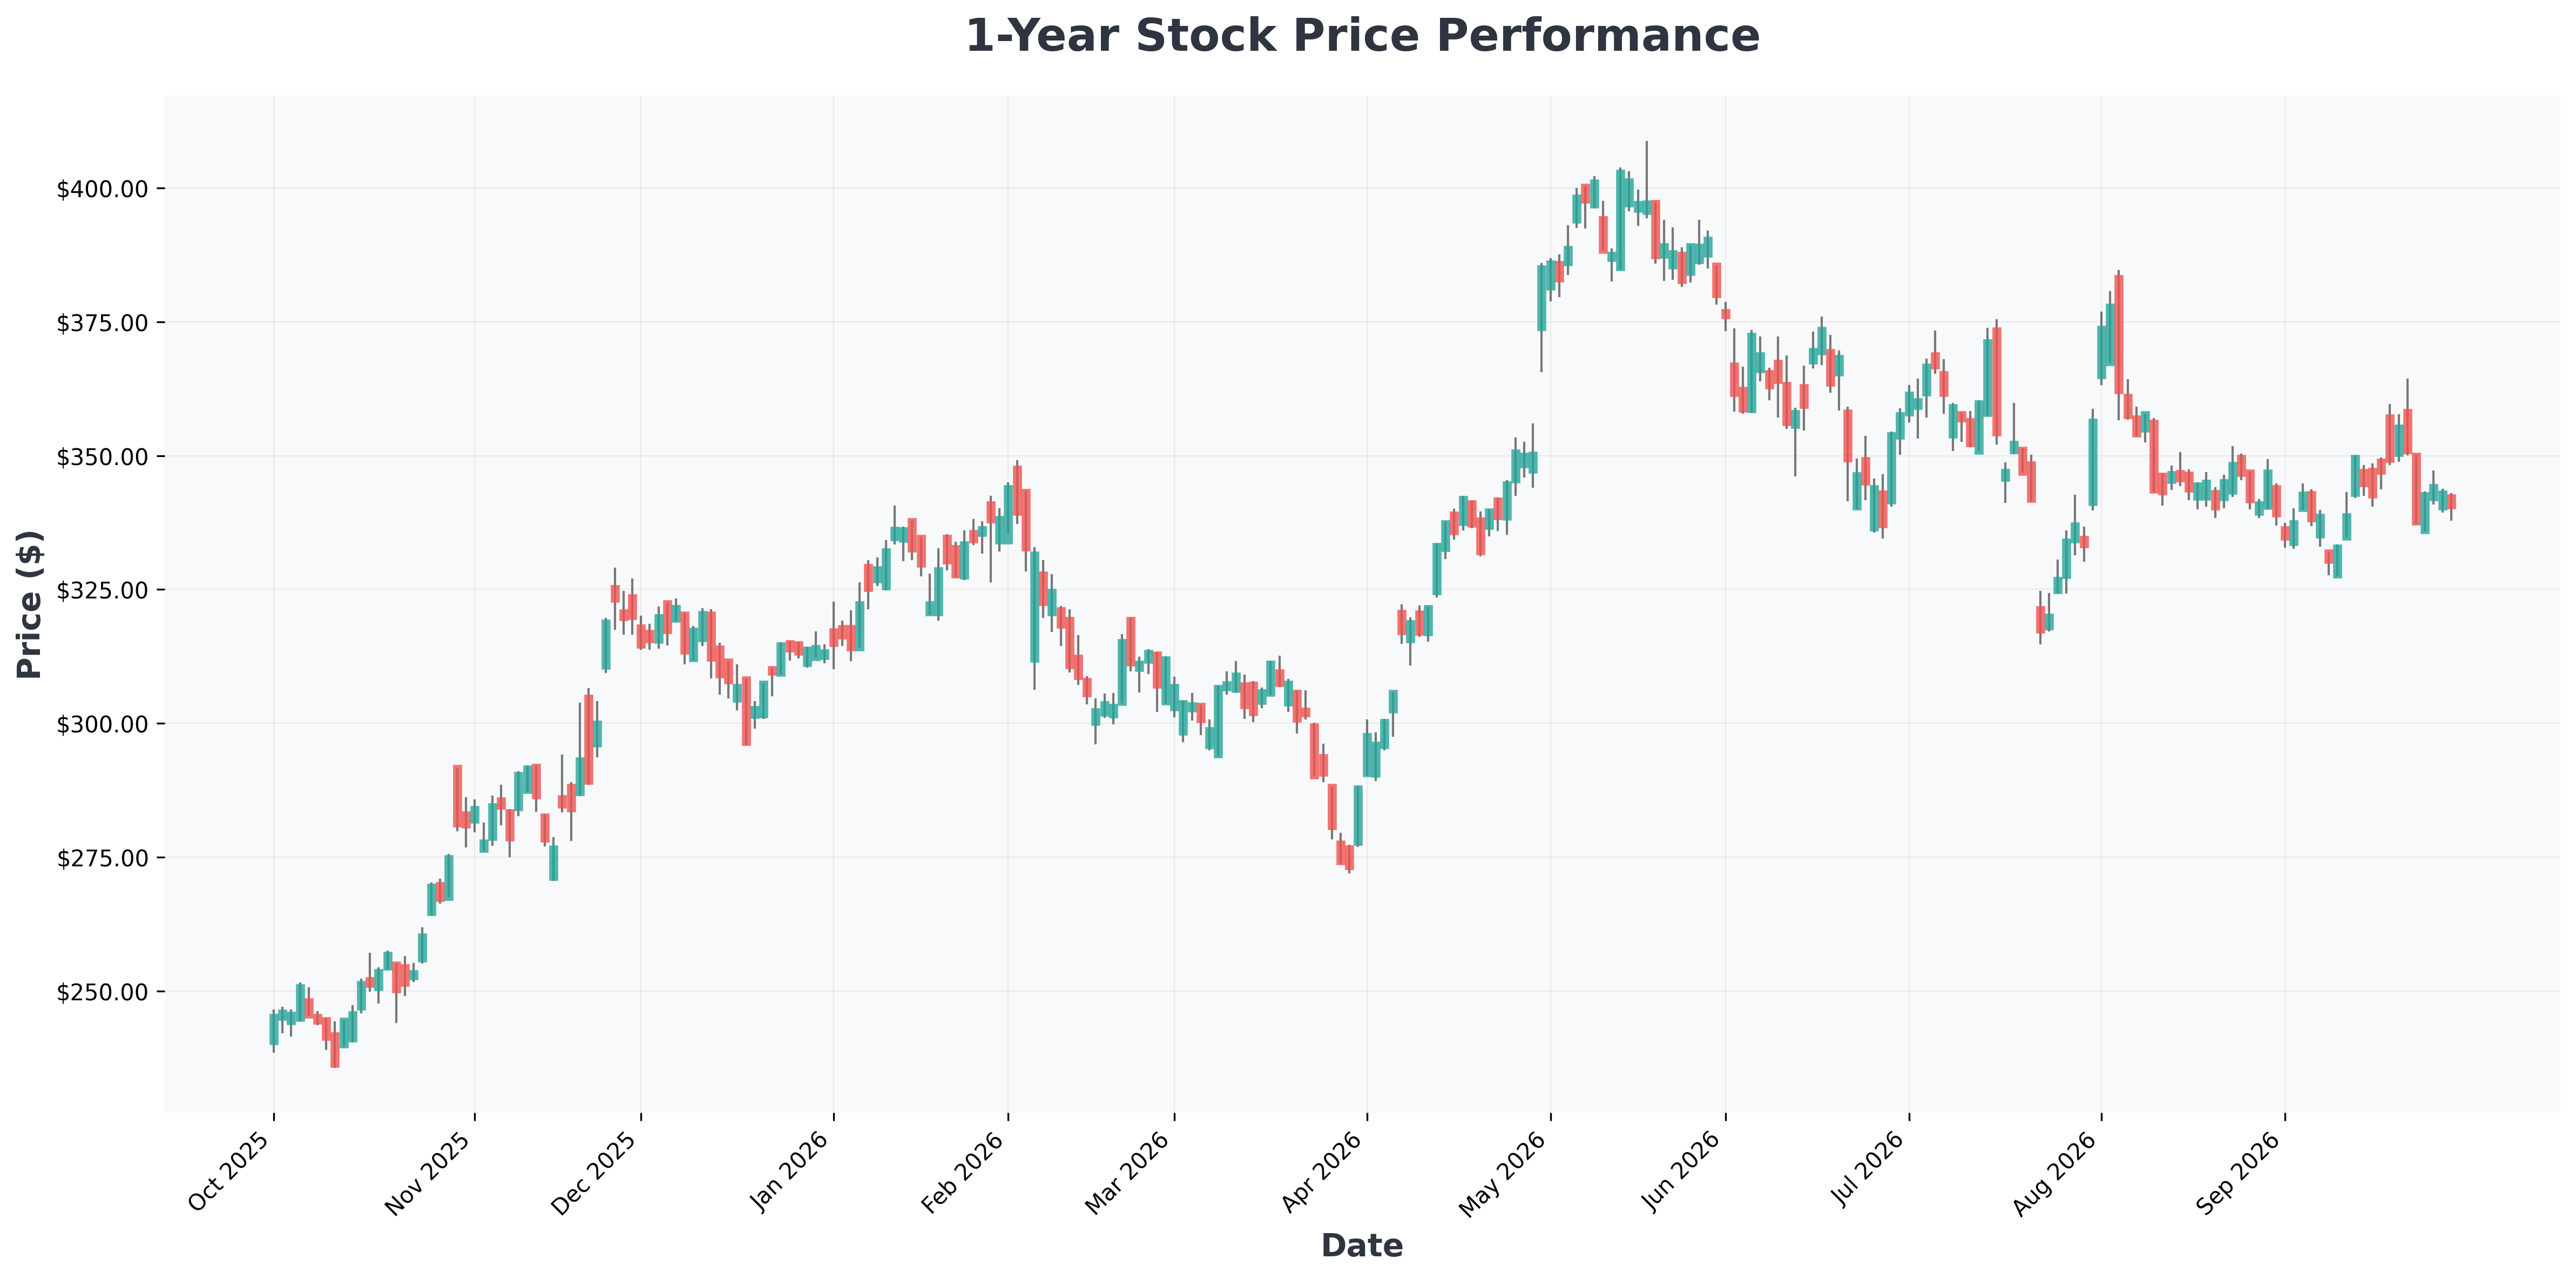

History Offers a Warning — and a Silver Lining 📉
This isn't the first time the market has concentrated this aggressively. During the dot-com era, between June 1994 and June 2000, the S&P 500's top 10 holdings jumped from 17% to over 26% of index value.
Since the current bull market began in late 2022, concentration has spiked from roughly 26% to 39% — a faster and steeper move than the late '90s buildup.
At the same time, valuations are stretched. The Shiller CAPE Ratio currently sits above 40, inching toward the all-time record of 44 set at the peak of the dot-com bubble.
| Metric | Dot-Com Peak (2000) | Today (2026) |
|---|---|---|
| Top 10 Concentration | ~26% | ~39% |
| Shiller CAPE | 44 | 40+ |
| Tech Sector Weight | ~30% | ~46% (6M return) |
| S&P 500 Drawdown After | -49% (2 yrs) | ? |
When the tech sector imploded after 2000, the S&P 500 lost nearly half its value over the following two years. No two bear markets are identical, but the setup today leans even harder on a handful of companies than it did then.
A Technical Note Worth Watching 🎯
From a technical perspective, the S&P 500 has been riding a multi-year uptrend, but breadth has been thinning. Watch the 200-day moving average as the key line in the sand — historically, sustained breaks below it during high-concentration regimes have preceded deeper corrections.
This setup has split the analyst community. Here's how the bull and bear cases are being argued right now:
📊 In-Depth Fundamental Analysis
| Company | Share Price | P/E Ratio | P/B Ratio | ROE | Operating Margin (OPM) | Revenue Growth |
|---|---|---|---|---|---|---|
| AAPL (Apple) | $333 | 38.15 | 45.25 | 148.75% | 32.62% | 16.40% |
| AMZN (Amazon.com,) | $249 | 20.04 | 4.87 | 30.56% | 13.69% | 19.60% |
| AVGO (Broadcom) | $351 | 45.26 | 16.82 | 44.25% | 54.31% | 85.50% |
| GOOG (Alphabet) | $341 | 17.09 | 6.69 | 48.68% | 34.03% | 24.20% |
| GOOGL (Alphabet) | $344 | 17.26 | 6.76 | 48.68% | 34.03% | 24.20% |
| META (Meta) | $725 | 27.34 | 7.07 | 29.85% | 34.83% | 28.00% |
| MSFT (Microsoft) | $513 | 28.54 | 8.61 | 34.04% | 45.11% | 17.70% |
| MU (Micron) | $1,065 | 24.10 | 11.94 | 66.64% | 80.37% | 345.70% |
| NVDA (NVIDIA) | $228 | 28.87 | 24.08 | 117.21% | 66.24% | 105.90% |
| TSLA (Tesla,) | $355 | 325.51 | 16.13 | 4.67% | 1.41% | 25.50% |

The Long Game Still Wins — But Position Sizing Matters
Here's the good news: if a pullback does come, the S&P 500 has repeatedly proven it can recover from even the most severe volatility. Since early 1999 — right as valuations began to soar into bubble territory — the index has still delivered total returns of nearly 1,000%.
Best-Case Scenario: AI monetization accelerates, hyperscalers hit break-even within 24 months, and earnings growth justifies current multiples. Concentration unwinds gradually as other sectors catch up.
Worst-Case Scenario: AI revenue disappoints, capex gets written down, and a valuation reset drags the index 20–35% lower — with the top 10 names bearing the brunt.
Base Case: Choppy sideways action with periodic 5–10% drawdowns, rewarding investors who dollar-cost average and rebalance rather than chase momentum.
Long-term investors have the most to gain regardless of what the next few years bring. Staying invested — and staying diversified — has historically been the most reliable way to protect a portfolio. ⚖️
