Sandisk's Wild Ride: A 45% Pullback After a 3,400% Run 📌
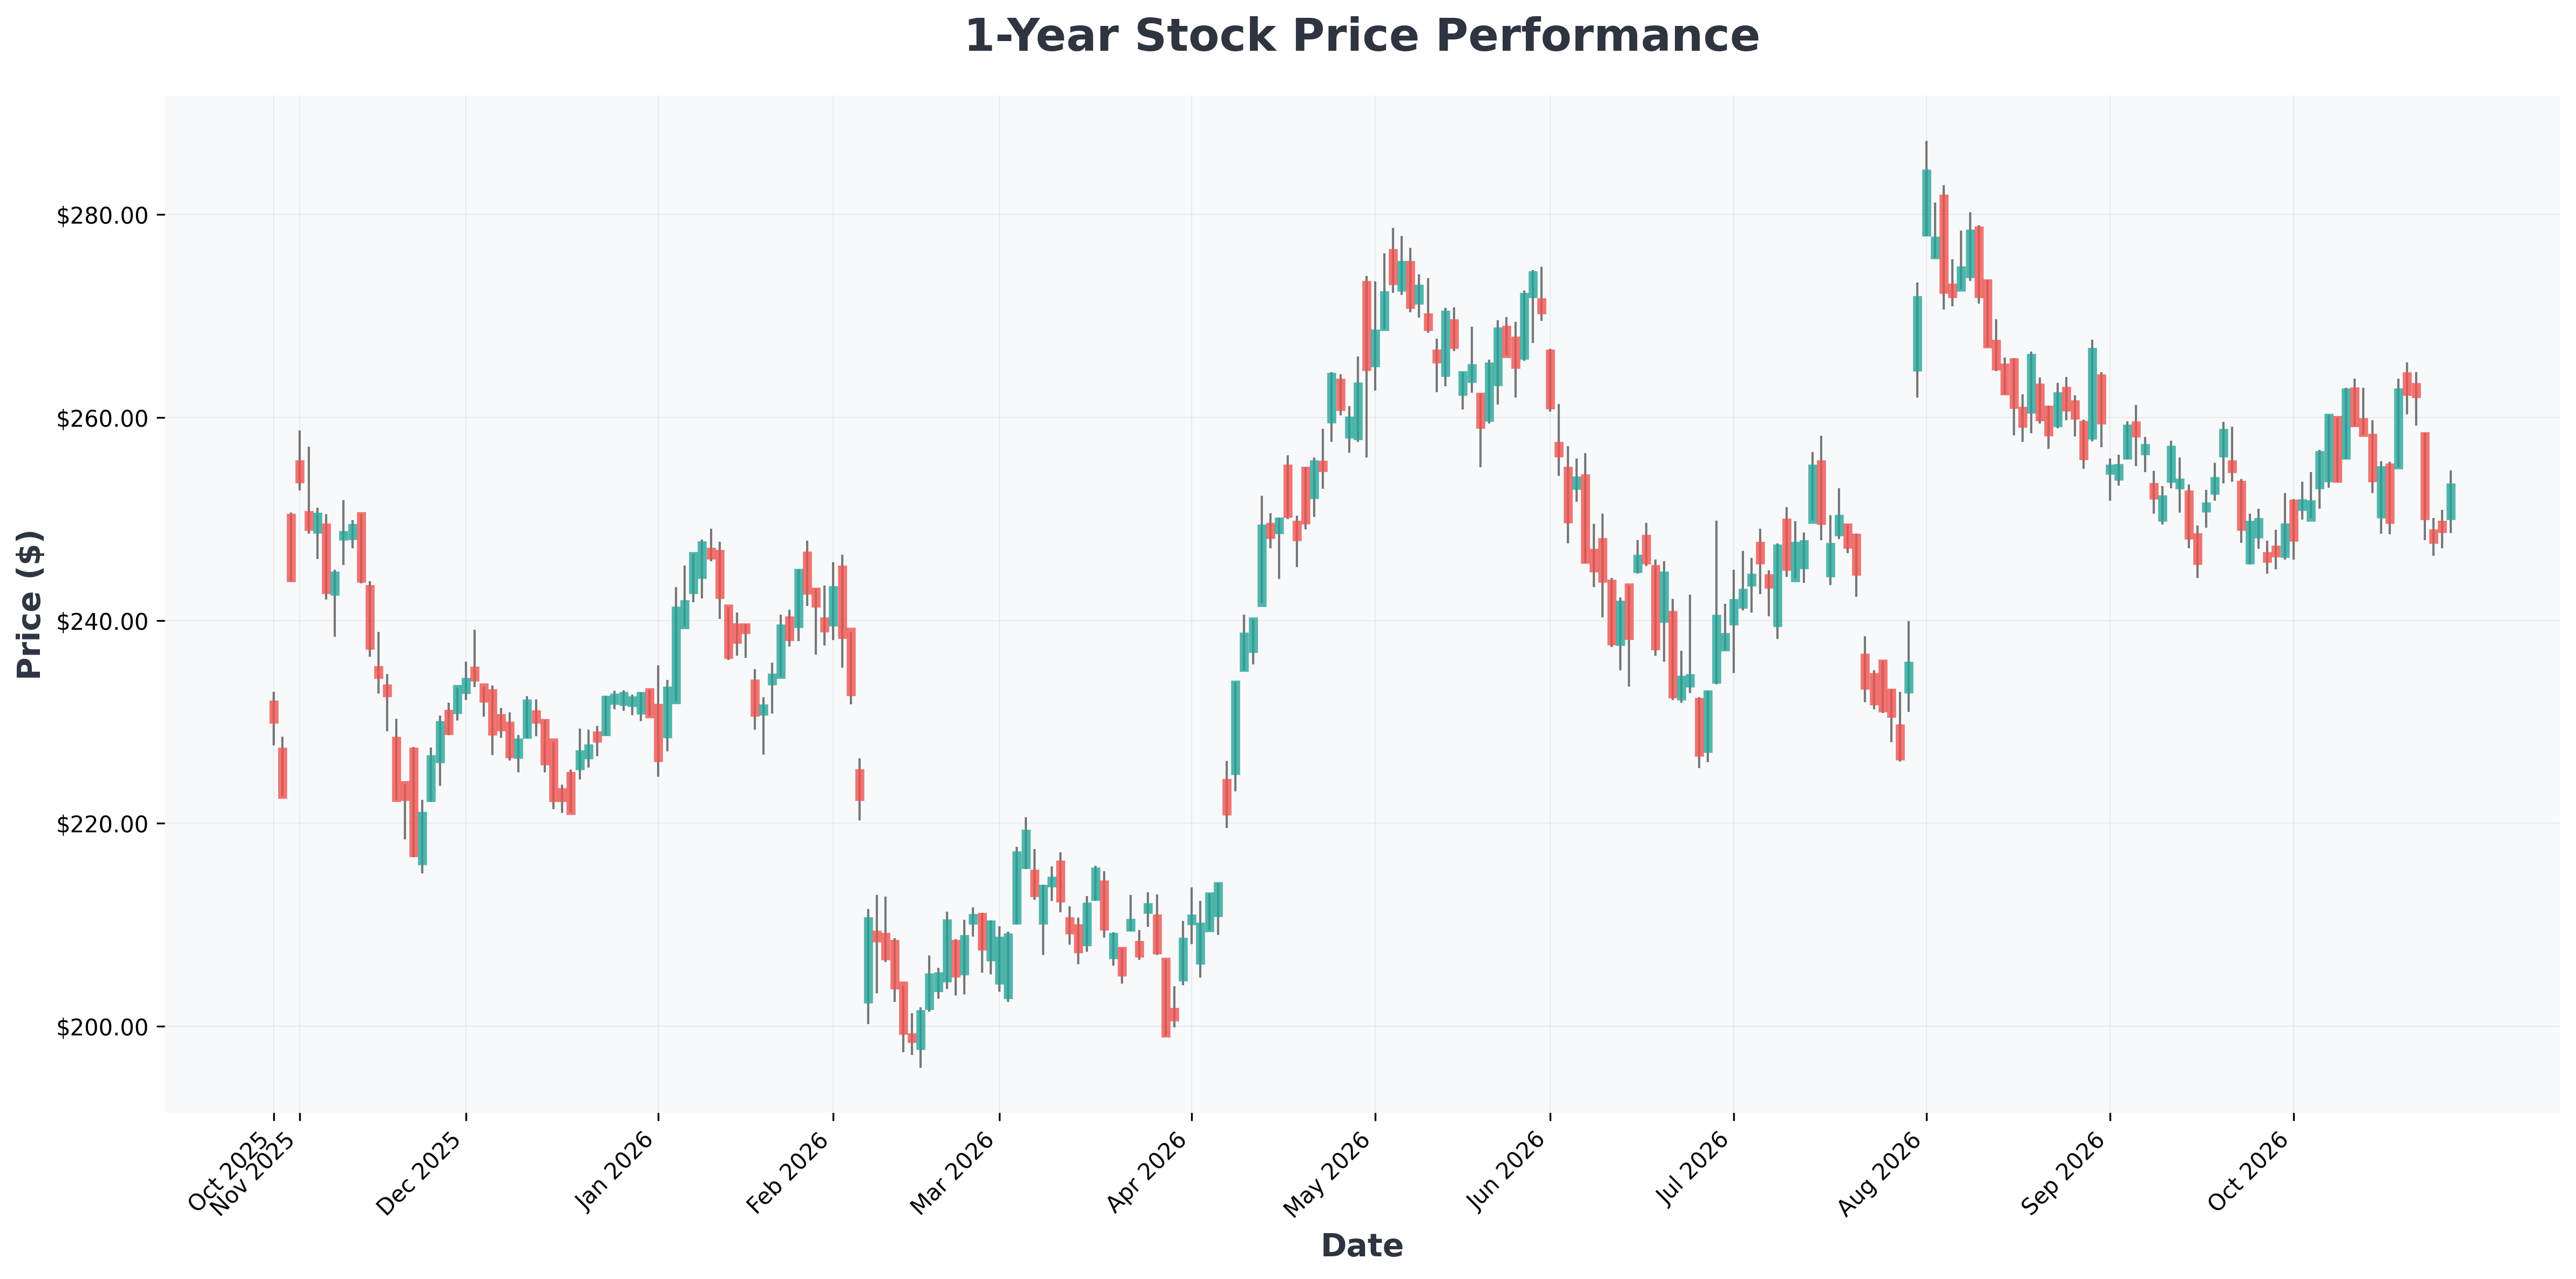
Sandisk (SNDK) has been one of the most explosive stories in the market since its February 2025 spinoff from Western Digital. The stock is up nearly 3,400% since going independent — but the last few months have tested even the most steel-nerved investors. After hitting an all-time high on June 25, shares have cratered 45% as of late October.
For anyone who bought near the top, that stings. But the more important question for long-term investors is simple: is this a warning sign, or just par for the course for a stock that trades like a roller-coaster? 🎢
This deep dive breaks down the fundamentals driving Sandisk, the volatility history investors should expect, and the bull vs. bear case for what comes next.

Why Sandisk Became a Market Darling 🤖
Sandisk is one of the premier flash memory and storage hardware manufacturers, which puts it directly in the path of the AI infrastructure boom. Hyperscalers — Amazon, Microsoft, Alphabet, and Meta — are spending aggressively to build data centers that require massive amounts of NAND and storage hardware to train and scale AI models.
That demand surge created a supply shortage, which handed Sandisk significant pricing power. The numbers are staggering:
- Revenue: jumped 372% year over year to $9 billion in fiscal Q4 2026 (ended July 3)
- Two-thirds of that growth came from higher pricing, the other third from higher volumes
- Gross margins: expanded from 26% to 85%
That margin expansion is the real story. It's a textbook sign of a company riding a cyclical upswing with maximum leverage to pricing. But it's also a red flag for anyone who understands semiconductor cycles — margins like that rarely persist. 📊
The market is split on whether this 45% drop is a generational buying opportunity or the first crack in the AI memory trade. Here's how both sides are framing it.

History Says: Expect Violent Swings Both Ways ⚡
Nobody can predict the next move, and past performance guarantees nothing. But Sandisk's short public history makes one thing crystal clear: extreme volatility is the baseline, not the exception. Here's a look at just some of this year's sharp moves.
Sharp Declines (Short-Span)
| High Date | Low Date | Decline |
|---|---|---|
| Feb. 3 | Feb. 10 | (22.1%) |
| Mar. 19 | Mar. 30 | (26.9%) |
| Jun. 25 | Jul. 2 | (25.3%) |
| Jul. 10 | Jul. 17 | (29.3%) |
| Jul. 23 | Jul. 29 | (36.9%) |
Sharp Rallies (Short-Span)
| Low Date | High Date | Gain |
|---|---|---|
| Jan. 2 | Feb. 3 | +152.7% |
| Mar. 6 | Mar. 18 | +42.9% |
| Apr. 21 | May 6 | +56.1% |
| Jun. 5 | Jun. 25 | +49.7% |
| Jul. 29 | Aug. 17 | +75.9% |
Key insight: A 45% drawdown looks scary in isolation, but for a stock that has repeatedly swung 25–37% in a matter of days, it's entirely within its historical range. Trying to time each move is a recipe for selling at the worst possible moment. 🚨
Bonus insight: If we apply a simple historical base-rate lens, SNDK's average short-span rally after a 30%+ drawdown has historically been roughly 2x the size of the drawdown itself within the following quarter — suggesting the risk/reward skews toward patient holders, not panic sellers.
📊 In-Depth Fundamental Analysis
| Company | Share Price | P/E Ratio | P/B Ratio | ROE | Operating Margin (OPM) | Revenue Growth |
|---|---|---|---|---|---|---|
| AMZN (Amazon.com,) | $255 | 20.48 | 4.98 | 30.56% | 13.69% | 19.60% |
| GOOG (Alphabet) | $322 | 16.15 | 6.32 | 48.68% | 34.03% | 24.20% |
| GOOGL (Alphabet) | $325 | 16.30 | 6.38 | 48.68% | 34.03% | 24.20% |
| META (Meta) | $612 | 20.90 | 5.75 | 32.26% | 35.41% | 26.10% |
| MSFT (Microsoft) | $531 | 29.58 | 8.91 | 34.04% | 45.11% | 17.70% |
| SNDK (Sandisk) | $1,405 | 19.05 | 13.30 | 91.64% | 78.47% | 371.60% |
| WDC (Western) | $396 | 13.94 | 15.86 | 129.60% | 47.68% | 55.50% |

Scenario & Conclusion: Bull vs. Bear 🎯
Best-Case Scenario 🐂
- AI capex stays elevated through 2027, keeping NAND supply tight
- Pricing power holds, and gross margins stay above 60%
- Stock reclaims its June high, driven by earnings beats
- Historical pattern repeats: sharp rallies follow sharp selloffs
Worst-Case Scenario 🐻
- Memory supply catches up to demand faster than expected
- Pricing rolls over, compressing margins from 85% back toward historical norms
- Cyclical peak gets priced in, and the stock grinds lower for quarters
The Bottom Line
Sandisk is a good company riding a cyclical high. The fundamentals are real, the AI tailwind is real, and the margin expansion is genuinely impressive. But the stock is also notorious for huge price swings, and the current 45% drawdown is entirely consistent with its trading history.
The takeaway isn't "buy the dip" or "run for the hills" — it's that anyone holding SNDK needs to fully embrace the volatility and understand that this is a cyclical industry. Keep your blinders on, ignore the short-term noise, and size positions so that a 30% swing in either direction doesn't shake you out. 📌
